
SATS Results
School Results 2024/2025
The information shows the attainment for our pupils in statutory assessments. When National figures are released, we will add these for comparison purposes. We are delighted with the excellent results across the school. They are a tribute to the children and the staff.
Early Years Foundation Stage
76% of pupils in Reception attained a Good Level of Development (GLD) against the Early Years framework. We are very pleased with this result which reflects an excellent year and takes into account a number of children that have done extremely well from their own starting points. The national average for GLD is 67.7%.
A Good Level of Development is defined as children working at the expected standard or exceeding the expected standard in the key areas of literacy, maths, physical development, communication and language and personal, social and emotional development.
Year One Phonics Screening
86.7% of pupils in Year One attained the expected standard in the Phonics Screening test. This is above the national averages for previous years and reflects the robust and effective phonics teaching that begins in Reception and continues throughout KS1. The national average for phonics screening is 67.7%.
Key Stage One
At the end of KS1 (Yr2), teachers are no longer required to submit statutory data. Data is monitored and tracked internally by Teachers and School Leaders to ensure children are making progress each year and working at the age-related standard in reading, writing and maths.
Multiplication times tables check
The average score for the pupils in our Year 4 cohort was 21.1 (out of 25 questions). The national average score for the 2024/25 Multiplication Tables Check (MTC) is 21.0.
Key Stage Two
We are very proud of our Year 6 pupils and all they have achieved last year. The KS2 SATs results reflect the hard work, determination, and progress that our children have shown throughout their time at our school.
A significant number of our pupils have additional needs, and we are incredibly proud of the progress they have made—especially in writing, where many have overcome substantial challenges. Their resilience, commitment and personal growth are achievements in their own right and deserve to be celebrated.
Our dedicated staff team continues to ensure that every child is supported to achieve their best. We remain fully committed to high standards and to providing a rich, ambitious curriculum that enables all pupils to thrive academically and personally.
Maths 76.2%
The national average score is 74%
Reading 85.7%
The national average score is 75%
Writing 71.4%
The national average score is 72%
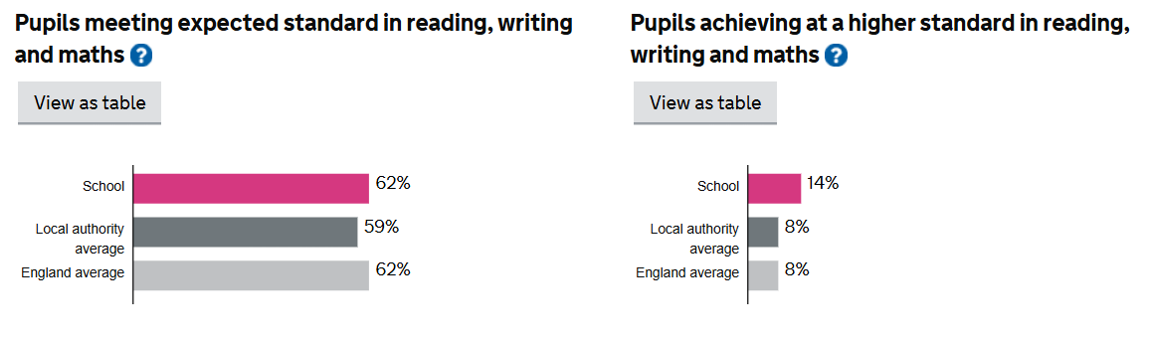
Combined RWM (reading, writing and maths) 61.9%
The national average score is 62%
The percentage of our pupils who achieved a higher standard in reading, writing and maths (combined):
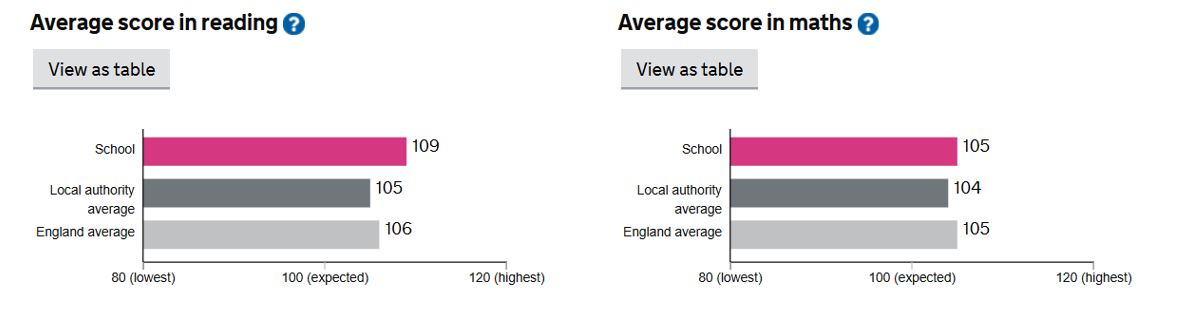
Average scaled score in:
Reading:
Maths:
It will not be possible to calculate key stage 1 to key stage 2 progress measures for the 2023 to 2024 or 2024 to 2025 academic years.
Please visit compare school and college performance service to see performance measures against other schools.